Because I'm interested in the answer (even though there still isn't a simple answer), I did a search and found the website where you can find something like an answer:
Using that site, I went ahead and generated some comparison maps of "insolation" -- solar power-per-area.
These two maps compare the average power received in March for a horizontal surface and a full-tracking surface:
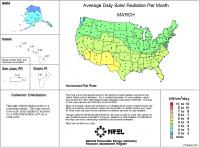
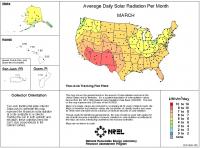
As you can see from the maps, these are real averages, not just theoretical calculations based on latitude. They include the effect of days when there's cloud/rain-cover -- which is why the usually-sunny Southwest has the most insolation.
So, for example, if you were camped in Wyoming in March a horizontal panel would receive 4 - 5 kWh/m2/day while a full-tracking panel would receive 7 - 8 kWh/m2/day. Moving your panel dawn to dusk to track the sun would give you, in that "March in Wyoming" scenario, about 67% more energy than a horizontal panel.
More maps, with comparisons for December and June:
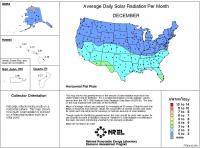
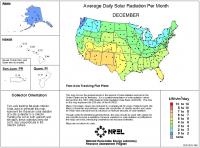
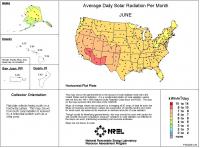
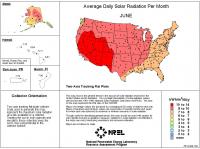
In December in Wyoming you'd get (on average) 120% more energy by tracking the sun compared to horizontal, while in June you'd get about 40% more energy .
These maps show why it's kinda hard to answer: "Can I get by with my current system if I move the panel to track the sun all day?" It depends a lot on what season you're camping and where you're camping. A systems that's adequate -- with full tracking -- in June probably would fall short in December, and one that's adequate in Arizona probably wouldn't be adequate in Wisconsin. And if you're not going to add more battery storage then you won't have more back-up for overnight or heavy clouds.
That said, I'm glad I found this insolation resource for my own use if nothing else.